Scroll down for your cheat sheet
Histograms show the spread of tonal information in a scene, and they're a great tool to help you ensure your image ends up with the most appropriate exposure.
Our main objective is to have this information lying within the scale, so that none of it ends up falling off either side. When it does, it means that an image is either losing shadow detail or highlight detail, depending on the side from which it's falling.
Sometimes, however, the histogram should show an unbalanced spread of information, with plenty on one side rather than the other, or alternatively, the majority bunched up in the middle. This isn't an error, just a consequence of photographing certain scenes and subjects.
How to understand histogram shapes
An abundance of information on any one side of the scale means that there is plenty of detail being recorded as shadows or highlights in the image. Usually this can indicate under- or over-exposure, but this is to be expected when shooting against very dark or very light backgrounds.
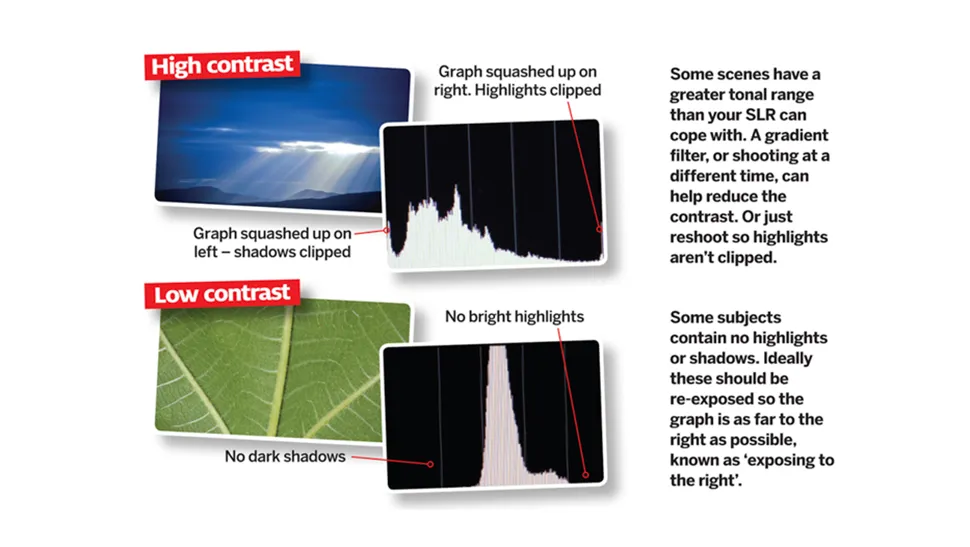
Likewise, plenty of detail in the middle but little or none at each side shows lots of mid-tone information but little shadow or highlight information. This is exactly what you'd expect when photographing a plain subject (such as the leaf shown in the cheat sheet below), particularly in low-contrast conditions.
Read more: Which shutter speed should you be using?
Sometimes you may have just plenty of information on the left-hand side and just a spike on the right, and very little in the middle. This indicates that the scene is high in contrast. In such a situation, you may be tempted to adjust your exposure to bring the majority of information closer to the centre of the scale, but doing so will be difficult without overexposing the image and sacrificing highlights.
Ultimately, your histogram should reflect the subject and conditions in which you're photographing it. Many scenes don't contain a balanced proportion of darker and lighter details, so you should expect their histograms to reflect this.
These are just some examples of why histograms aren't always balanced and even. Check out our cheat sheet below and make sure your histogram never baffles you again!
Make sure to come back for more handy photo cheat sheets!


